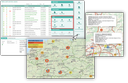
At the overview list of sales cases and the combined overview of sales and service processes, you can use the functions of the Map group to display the number of cases under the costumer’s address, and a small pie chart with segments corresponding to the selected criteria.
The circle represents the number of companies. After clicking, the circle falls apart into further individual locations. Clicking on a single circle displays the information about the company from the master data and key figures.