JustRelate CRM supports you with developing a systematic and activity-oriented marketing and sales concept. Flexible planning, analysis and presentation options are the uniform basis for a successful revenue trend of your company. JustRelate CRM enables you to structure your commercial activities, evaluate them and develop alternatives.

Business intelligence
Analysis at hierarchy level
A sales manager with administrator permissions can carry out analyses across the entire company hierarchy (Administration/ Contacts/...internal departments menu), while analyses performed by users without administrator permissions are limited to cases or planning objects of which they are the account manager.
Based on real-time analyses, the CRM enables you to obtain information about accumulated revenues, gross profit margins and profit contributions of customers, for example. The same applies to the analysis of the industries and regions you are active in. Analyzing the potential lets you capture the revenue opportunities of a sales unit (sales staff, partners etc.) based on recent customers as well as available data from completed periods of time. The customer analysis gives you an overview of the customer ranking of the various sales units, broken down to sales operations.
JustRelate CRM provides a comprehensive solution for your customer data to all users and managers, including senior management, marketing, sales and service managers, through:
- The user and company cockpit,
- Drill-Down Center,
- Sales funnel in the forecast,
- Trend Center.
Key figures in the cockpits
With JustRelate CRM, you can create your own cockpits or dashboards that clearly map the key figures and analyses from your own area of responsibility. Here, the solution’s sophisticated access management applies as well. In addition to the personal cockpit, you can evaluate the performance of your customers and vendors by means of a special company cockpit. This direct key figure view on individual companies offers significant opportunities, for example in key account management. The cockpit elements can be configured individually and are easy to parameterize.
The standard includes numerous preconfigured cockpit elements that can be used immediately. The element catalog can be customized, adapted or extended.
Compressed data in the drill-down center
In the drill-down center, you can evaluate and compress data in three levels: business opportunity, quotation, order, customer, and product / service. This allows analyzing, e.g., the order value of products of a particular product line by customers. Once defined, analyses can be saved and retrieved. The system displays the analysis result in a large fact table that spans across all dimensions. Selected results can be presented compactly in the cockpit. All drill-down analyses are performed periodically (for example, several times a day) to provide up-to-date results.
Trend center
Drill-down evaluations with time compression (day, month, quarter, year) can be used to display sales / price / cost comparisons per line in the results table. You can identify trends and derive actions via various dimensions in a highly flexible manner, for example at product, sales, customer, or employee level.
Using these drill-downs as a data source, it is possible
- to compare the monetary values in columns,
- to calculate trends from the values,
- and to filter downstream on values and trends.
Visualization as a sales funnel
To optimize sales control (in sales and after sales), the sales pipeline can be visualized as a sales funnel by weighted or unweighted sales turnover. The presentation of the ideal funnel can then serve as a default for sales control. The presentation of the real funnel offers you the added value to recognize at a glance whether your forecast is "healthy", or you need to invest, for example, in lead generation. At a click you can additionally see which products / services are offered in, e.g., the respective offer.
Overview lists
For process monitoring, watchlists (dynamic filters) and overview lists for all business objects, e.g. for contacts, activities, sales, marketing or service operations are available and can be defined freely.
In these overviews, you can extract data using user-specific filters such as "My projects" by various points of view. All overviews include useful features that ease your work (selectable sorting, e.g., by Get/Go probability, weighted turnover or status, automatic subtotal display, e.g., for determining the order value of several quotes). The results can be exported to Excel at the touch of the button, and then processed there as needed.
Reports with the report manager
Using the Print command for overview lists and other objects, you can open the report manager which offers numerous reports with graphical evaluation (for example, quoting process with proportions of the individual product lines, or with the proportions of the individual statuses in weighted sales).
Fast map display of the pipeline
In addition to the so-called business intelligence tools, "Sales cockpit", "Company cockpit", and "Drill-down center", the CRM integrates overview lists for all business objects, e.g. for contacts, activities, sales or service cases. In these overviews, you can use user-definable filters, such as "My actions", for extracting data according to various aspects.
You can use the Map ... function for a geographic display of the number of cases at the business address, as well as a small pie chart with segments for the selected criteria.
With pie charts, the mouse pointer (mouseover) displays various pieces of information about the company from the master data, and key figures. The pie presents the number of companies as a condensed number. At a click, the circle is broken down into further individual locations.
Ad hoc-analyses in the neutral product catalog
As an administrator, you can open the neutral product catalog (product database). In the product mask of the Sales subform, the Products in cases list can be used, for example, to create overviews with the help of the When time filter (e.g., sold this business year).
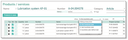
How often was a product offered or sold in a specific period of time?
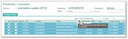
A simple summation across selected entries. This feature is available for numerical fields in all lists.