Trend Center

Drill-down evaluations with time compression (day, month, quarter, year) can be used to display sales / price / cost comparisons line-based in the results table. In a highly flexible manner it is possible to iden­tify trends and to derive actions via different dimensions, for example at product level, sales level, cus­tomer level, employee level.

In the Trend Center it is possible to use these Drill downs as data source to

  • compare the monetary values to be compared in columns,
  • to calculate trends,
  • to filter downstream on trends and values.

The table in the upper section presents the annual comparison. For the active record, the comparison can be called up on the monthly or quarterly level in the sub tabs. The used configuration can be stored by a name as a trend record.
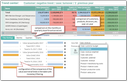
Trend center with values from a drill-down

You can open the Trend center for already defined comparisons from the menu Extras/Trend center. New comparisons are always created from the Drill-down-center via the function Open Trend center. To open existing trends, use the pull-down arrow in the Trend Center's title bar. The trend can be represented as an element in the cockpit too.

Values comparison

As you can see, the Filter/Settings correspond to the value columns, Trend, Value (total), Value (propor­tional), etc. The values to be displayed you influence by selecting the Value field (key figures), the num­ber of Previous year or with monetary entries in the comparison fields (<... <) of the filtering.

Value (total)

The total value always refers to the calendar year or to the current business year (see - set business year)

Value (proportionally)

In other words, this means an annual amount. The current year is usually not finished yet. You do not want to compare the current period of the current business year with the entire previous year or pre­vious years, but only the current period with the corresponding proportional period of a previous year.
Therefore, "proportionally" means when the current date is 05.05.2016 the period 01.01. until 04.05. of the previous years are used as a comparison to determine trends. This also takes account of sea­sonal fluctuations.

Schematic example: In the drill-down center, the orders of the year 2016 (current BY) are aggregated to customer level and then be transferred to the trend center. Here, the product: sales price is set as the key figure in the value field. This gives you an overview of all customers and their current sales trends compared to same previous years period.