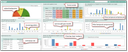
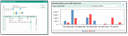
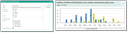
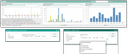
Some exemplary cockpit elements

There are already numerous preconfigured cockpit elements. With some elements (e.g., the filter dia­gram or filter list), several alternatives, which are preconfigured in each case by means of a special variable, can be used. Therefore, several elements of the same type can be used with different preconfig­ured filters.

In addition to the more than ten preconfigured cockpit elements for quotes and orders, there are many filter lists, filter bar charts and filter diagram elements for sales. There are also elements for drill-down graphics, a drill-down list and the Trend Center.

The situation is similar with the cockpit elements of other modules.

In this overview, we have listed just a few of the many cockpit elements available.
  • EUREKA Search
  • Cockpit calendar
  • Watchlists
  • Filter list - several variants
  • Forecast
  • Sales funnel (Sales; Service; Sales/Service)
  • Visits in this business year - 2 variants
  • Drill down graphic - several variants
  • Drill down automatic
  • Trend center
  • Filter bar chart 4 variants
  • Filter bar chart compression (grouping)
  • Filter date compression
  • Leads
  • Calls per month - 2 variants
  • Calls per month (total inclusive previous year)

Note: An element can be used simultaneously on several cockpit pages. But for configuration, you can only use the available number of elements and their variants. An element or a variant thereof can only be used once per cockpit page. This element is then not available again for the same page or for other cockpit pages.

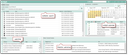
Example cockpit page

Note: Various cockpit elements offer select functions that can be used as "functions at the sub-dialog" when selecting list entries. The "Drill-Down List", "Filter List" and "Trend Center List" elements, for example, offer select functions that extend the evaluation options.

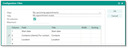
The "EUREKA search" cockpit element can be included in both the user's cockpit and the com­pany cockpit. The default EUREKA search can be found in the title bar of the cockpit.

Cockpit calendar

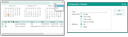
As an alternative to the Entry Portal in a separate window, there is the "Calendar" cockpit element with a calendar control, a selectable period of time, and synchronization of the activity list. On synchronization, the list content depends on the selected period. The date of appointments with activities is shown in bold font in the calendar control.

Activities in the list can be completed by clicking the icon in the status column, just like for activities in the Entry portal. By means of a pull-down menu in the calendar, you can switch the view to All or Open.

Note: To present the activity list under the calendar, a vertical range of at least "2" must be selected.

“Calendar” cockpit element with activity list

Watchlists

The list displays watchlists, similar to the watchlists in the favorites folder of the CRM desktop. If watchlists are created, i.e., added as filters to the favorites, reconfigure the list for the cockpit and generate it:

  • Open the watchlist from the favorites section, and leave the form open.
  • Switch to the cockpit and configure an empty area. The watchlist can be found in Other.
  • Open the cockpit again.
  • Click in the cockpit element, and select New or Insert watchlist from the context menu. You should then see all open watchlists.
  • From the selection list of the watchlist concerned, select the field to be summed up in the “Value” column of the “Watchlist” cockpit element, e.g. the turnover. If no field is selected, the watchlist only displays the number of records found.
  • OK adds selected watchlists as an item to the cockpit element.
  • Proceed as described above to add another watchlist to the element.

Filter list, several variants

The element shows the filter result as a list. The element’s list fields to be displayed can be freely selected. The configuration of the fil­ter and the fields is similar to that of the Drill-down list.

List fields of a filter result

Server variable

  • PSA_CCP_FLT_DIA_001/2/3/4_SCI: DTO and dialog

Further examples

Example page with Forecast, Drill down, funnel and visits chart

Forecast

The chart shows the quote value (revenue unweighted) of all businesses opportunities (optional) as well as all quotes, grouped according to the Get probability, restricted to the business opportunities or quotes of the selected Commercial agent or Technical agent as well as the Sales partner. The width and height of the chart can be specified for the minimized and maximized view. The link below the chart opens the case list.

Forecast chart

Server variables:

  • PSA_CCP_PRO_SUC_PRB_SCI_DEF_PAR: value for the configuration dialog
  • PSA_CCP_PRO_SUC_PRB_SCI_QUE: search condition

Sales funnel (sales, service)

Presentation of the sales funnel (see also Sales, Main status in sales).

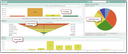
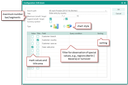
The sales funnel elements are main statuses that summarize several process statuses. The cockpit element can be configured with attributes from the Sales funnel tab, and with a filter to display the data.

Sales funnel configuration, "Sales and Service" real funnel

Server variables

The internal variables for defining the data object (on which searches are performed) and the dialog that can be opened via a hyperlink, as well as to determine the default parameters for the element’s configuration are:

  • PSA_CCP_SAL_FNL_001_SCI / PSA_CCP_SAL_FNL_001_SCI_DEF_PAR
  • PSA_CCP_SVC_FNL_001_SCI / PSA_CCP_SVC_FNL_001_SCI_DEF_PAR
  • PSA_CCP_SVC_SAL_FNL_001_SCI / PSA_CCP_SVC_SAL_FNL_001_SCI_DEF_PAR

Visits in this business year, two variants

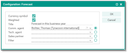
Two elements, each of which displays a bar diagram showing the year overview of all visits, scaled by months, and restricted to specific appointment Types (select menu), as well as for a business year (before last, last, current). Alternatively, two staff members or teams can be selected (Agent), and the number of their visits be compared.

Configuration of customer visits

Server variables:

  • PSA_CCP_APM_COM_YEA_001/2_SCI_DEF_PAR: Default value for the configuration dialog
  • PSA_CCP_APM_COM_YEA_001/2_SCI_QUE: Search condition

Drill down graphic, several variants

The results of a Drill down analysis can be displayed not only as a list, but also graphically as a bar or pie chart.

Configuration of a Drill down chart

Maximum: Limits the result list to a maximum number of top records according to sorting. Example (see pic­ture): Sorting "-1" in the Sales price field, and Maximum = 5 displays the turnover of the 5 best regions.

Sorting: From the n quantity of a Drill down analysis, you can display the top elements in the chart in ascending (+) or descending (-) order. The sorting works just like the sorting of filter results.

Value column and Title column: From the selected field in the title column, the title area in the picture is created. As value fields only fields with decimal values are suitable.

Note: In the configuration of the drill Down design, an additional field does not need to be stated in the value column, because it can be simply grouped and counted by its title. Previously, only decimal value columns of the drill Down-fact table could be accumulated.

Server-Variables:

  • PSA_CCP_DRL_DWN_DIA_001/2/3/4_SCI_DEF_PAR: Default value for the configuration dialog

Drill down, automatic

  • Drill-down graphic (automatic)
  • Drill-down list (automatic)

There is a cockpit element for the drill-down list and one for the drill-down diagram, with "automatic" added to the name, because the columns / fields are automatically selected.

Info

Admin: Further elements can be created using the Copy function in the element administration.

With the other drill-down elements, you can alternatively select a search path from a drill-down definition in the drill-down cockpit element but had to / could select fields (if they are existing in the search path) or had to / could define new fields in the element,

With "...automatic" elements, a sales employee (key user) can define a drill down and the fields for the result presentation of the drill down. With this cockpit element, you immediately get the results of the drill-down without having to worry about list boxes. This "drill-down element (auto­matic)" lets you display any result lists (corresponding to the specified search path with a field definition) in just one drill-down element.

In the elements, no list fields are defined when configuring the element, but only a default search path is selected that already contains the specific fields (result table).

In the cockpit element itself, a drop-down can be used to switch between several drill-down paths. If you have fields in the search path already, the result is immediately present.

Configuration of a drill down graphic (automatic)

Cockpit page with Trend center, temporal compression and others

Trend center

See also: Trend Center

Filter bar chart, several variants

This element works like the "Filter chart" element. However, you can choose several fields whose values are cumulated and displayed as a bar or pie chart.

Filter bar chart, compression (grouping)

The "Filter bar chart" element enables groups to be formed for a field according to months or years. In the Group field of the configuration dialog, a grouping method can be selected, for example, the grouping by the year for a date field. Next to this, the main grouping can be specified. The groups selected here are displayed on the x-axis. The main group is only evaluated for bar charts, not for pie charts.

Revenue per commercial agent and year

Server variable

  • PSA_CCP_FLT_BAR_DIA_001/2/3_SCI: DTO and Dialog

Filter date compression, three variants

Allows you to compress key figures (number or value) of periods (e.g., month, quarter) within a period (e.g. calendar year, financial year), optionally including a comparison to the previous year. This element is available for evaluating activities, service calls and sales cases.

Comparing to the previous year in business opportunities/quotes in the month

Server variable

  • PSA_CCP_FLT_DAT_CMP_001/2/3_SCI: DTO and dialog
  • PSA_CCP_FLT_DAT_CMP_001/2/3_SCI_DEF_PAR: configuration parameters

Leads

  • Leads by classifications in the business year - as bars with a filter as the basis
  • Leads by source in business year- as stacked bars with a filter as the basis
  • Leads per month
  • Leads per source
  • Leads per source and month

Example:

Leadmanagement (Lead request)

Calls per month, two variants

Two elements, each of which displaying a bar diagram showing the annual overview of all phones calls in the comparison (connected, not connected), with monthly scaling. It can be restricted to a connection direc­tion (incoming, outgoing, both), a status (connected, not connected, both), and the call duration. Alternatively, two staff members/teams (Contact) can be selected to compare the number of calls (Compare contacts checkbox). The hyperlink on the bar chart opens the CTI call protocol.

Calls per month

Server variable

  • PSA_CCP_CTI_CLL_MON_SCI_DEF_PAR: Default values for the configuration dialog

Calls per month, including the previous year

A bar chart showing the annual overview of all phone calls with monthly scaling, including a comparison to the previous year. It can be restricted to the connection direction (incoming, outgoing, both), status (con­nected, not connected, both), call duration, and the business year (before last, last, current). The hyperlink on the bar chart opens the CTI call protocol.

Server variable:

  • PSA_CCP_CTI_CLL_PRS_001/2_SCI_DEF_PAR: Default value for the configuration dialog
Attention

Attention: A click on the respective cockpit element opens the CTI communication log, where all commu­nication data of the company, i.e., the CRM users can be seen.

Note: If privacy concerns exist, it is possible, to set a job parame­ter to specify how old the protocol records may become before they are processed by the PSA_CL­R_CTI_CLL_LOG job ("Clean up call log").

Attention

Attention: Telephone numbers without personal reference must be protected.
§GDPR: When accessing the communication data, data privacy aspects must be observed. All phone numbers assigned to an external contact not registered in the CRM are subject to data protection and must not be processed without consent.
It is irrelevant that the telephone numbers have no visible personal reference. Personal data is informa­tion of any kind that relates to a person who can be identified at least theoretically (Art. 4, No. 1 GDPR). This means that the person does not have to be identified. It is sufficient that the person could be identi­fied with the help of the available data (telephone number).

Preventing misuse

To restrict the misuse of this call log, access to these cockpit elements must be defined with clear access rights. If necessary, the access to the result list of the hyperlink must also be defined.

Note: Since it is not possible to differentiate the connection log entries with phone numbers of not registered con­tacts into business and private calls, the CTI call log must not be interpreted or used for user performance assessment!

Deactivating or restricting the CTI call log

Every user finds the log of his own calls under Back Office/My Calls, and can delete the entries in it at any time. You can prevent logging by yourself at any time by changing the CTI configuration or the variable val­ues. The CTI configuration can also be found under My Data as the CTI function.