Getting Started

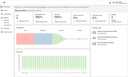
After logging in to Automations, your dashboard is displayed. It can also be accessed via the navigation to the left. On the dashboard, the statistics for the most recent mailings is displayed. Using the links in the “Recently visited” section on the right-hand side, you can continue working where you recently left off.

If you wish, you can jump right in and create a mailing!

Mailing statistics

A statistics overview is available for every mailing, not only for the most recent ones. If you click “Mailings” in the main navigation, the list of mailings is opened, and you can pick one to view its statistics. The individual statistical values indicate the following:

Value

Description

SentNumber of emails sent in the stated period of time.
Deliverability ratePercentage of emails that were delivered, i.e., that didn’t bounce.
Opened countPercentage of emails that were opened. This value is determined using a small image that is requested via an <img> tag. 
Click-to-open ratePercentage of recipients (measured against “opened count”) who clicked one or more of the linked elements included in the emails.
Complaint ratePercentage of emails that were marked as spam. 
Bounce ratePercentage of emails that couldn’t be delivered because the mailbox doesn’t exist (“hard bounce”), or has run out of storage space, for example (“soft bounce”). 
UnsubscribedPercentage of recipients who unsubscribed from the mailing.

After all emails have been dispatched, it may take a couple of days until the “Opened count”, “Clicked count” and “Unsubscribed” percentages are reliable.

Note that the “Opened count” percentage usually is much lower than the percentage of the recipients who actually opened the email. This is because many email clients block remote content, causing the small image, which is contained in the emails for the purpose of counting, not to be requested.